What the paid products are genuinely good at
Hosted APM products earn their price for the teams they are built for. Install an agent, and within the hour you have traces across services, slow-query breakdowns, error grouping with stack traces, deploy markers, and an alert that can wake the right person. For a company with dozens of services, an on-call rota and customers who notice a bad minute, there is no serious argument for building that yourself.
We are not that company. We run sixty containers on two small servers (the previous piece, Extreme bootstrapping, describes the estate), and most of them are demos and early products whose traffic is measured in hundreds of requests a day. For that shape, the per-host and per-gigabyte pricing of the hosted products buys a great deal of capability we would never open, and it sends our request paths and error messages to someone else’s cluster to do it.
So we asked what an APM product is actually selling, piece by piece, and where each piece already lives on our own machines.
Three things on one invoice
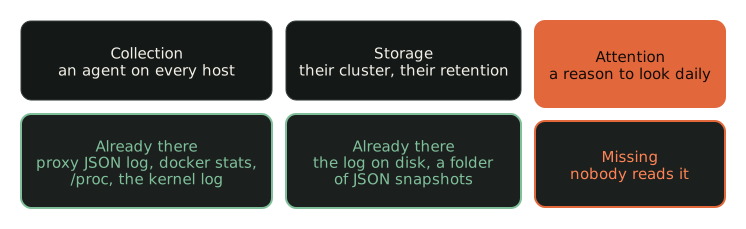
Collection is the agent. On our hosts it is redundant. Every request already passes through
kamal-proxy, and kamal-proxy already writes one JSON line per request: the host, the service it routed
to, the method and path, the status, the response size, the user agent, and the duration in
nanoseconds. That line is a web transaction. The memory and CPU of every container are one docker
stats away. Swap, disk and the kernel’s OOM kills are in /proc and the kernel log.
Storage is their cluster. Ours is the log Docker already keeps (with rotation set to cover the window we query) and a folder of JSON snapshots on a laptop, one per run. A trend is a diff of two files.
Attention is the part that is actually scarce, and it is the part the paid products are best at creating. A dashboard someone opens every morning, an alert that turns red. Without it, the data on our servers was complete and unread. Nobody ssh’d in to look at memory until something broke.
That last box is the whole design problem. Collection and storage were solved by accident. Attention had to be built.
The pull
The tool is one Python script with no dependencies beyond ssh, called boxwatch. It installs nothing
on the servers. For each host it makes two round trips. The first collects memory, swap, disk, load,
uptime, the kernel’s OOM-kill count, and every container’s state, memory against its cap, restart
count, OOM flag and health. The second streams the proxy’s request lines for the window, gzipped,
back to the laptop.
From the request lines it computes, per service, what the transactions page of an APM shows:
throughput, the split by status class, the 5xx rate, p50, p95 and p99 latency, an Apdex score, and
the slowest transactions with ids collapsed (so /orders/123 and /orders/456 count as one
transaction). It also computes two things the hosted products tend to bury: the share of each
service’s traffic that is a crawler, by name, and the number of exploit probes (/.env,
/wp-login.php, /cgi-bin/../../bin/sh) hitting the public addresses.
It writes three files. A self-contained HTML report for a person. A compact Markdown summary written to be read first. And the JSON snapshot that the next run diffs against. If any alert is critical it exits with status 2, which is all cron or CI needs to know.
A 24-hour pull of both servers, about eight thousand requests and sixty containers, takes under thirty seconds.
Who reads it

The summary is written for a coding agent, and the repository ships the playbook the agent follows.
It reads the summary first, in a fixed triage order: unreachable hosts and critical alerts, then
memory headroom, then per-service errors and latency, then crawler share, then the probe noise. For
anything red it follows the thread with more read-only commands (docker logs, journalctl -k,
docker system df, a grep of the proxy log for one service’s 5xx lines) and writes a short dated
note: what was red, what it looked at, what it recommends.
The playbook draws a hard line around what the agent may do on its own. Reading anything is free. Restarting, stopping or removing a container, pruning, changing a proxy route, anything on the server that carries revenue: it asks first. Removing a Docker volume is forbidden outright, because on a server like ours the volume is the database. The model is good at reading logs. It does not get to be the person who decides what to kill.
What the first run found
The first real run, this morning, earned its keep twice. On the server that carries the paying product, the largest consumer of memory was neither the product nor its database. It was a buildkit container left behind by the last remote deploy, idle, holding 521 MB, which is more than a quarter of the machine. On the other server, swap was completely full, available memory was 217 MB, and the kernel had logged nine OOM-kill lines in the window, one of them killing a build container mid-build. Neither problem had caused an outage yet. Both would have, and neither was visible from any page a visitor could load.
The latency table was mostly reassuring and occasionally pointed somewhere useful. Most services had
a p95 well under a quarter of a second. The handful that did not had slow /robots.txt and static
asset responses, which is the signature of a starved process rather than a slow route, and pointed
straight back at the memory finding.
The crawler column told the most interesting story. On several small demo services, one AI crawler
was between 60% and 80% of all traffic. That is not new to us. A month ago a three-day read of the
same log showed one crawler had made 29,368 requests to a single demo whose interface was query
parameters, 98.5% of everything that server served, because a crawler can enumerate query strings
forever. The fix then was a one-megabyte container that answers /robots.txt for any host, mounted
on the proxy by path prefix, so no application had to be rebuilt. The point is that a hosted APM would
have shown that traffic as healthy throughput with excellent latency. Reading our own log showed it
was a cost.
Where the data goes
Nowhere. That is the second reason for doing it this way, and for some products it is the first.
The request log contains paths, and in an application that holds private data, paths contain things. A record id, a share token, sometimes a name in a slug. Shipping that to a third party’s cluster is a data-processing decision with a contract behind it. Reading it over SSH into a file on a laptop is not. boxwatch collapses ids and tokens in paths before it reports anything, but the stronger guarantee is architectural: the raw lines never leave machines we control.
Where this is wrong
There is no distributed tracing, no code-level profiler, no error grouping with stack traces, and nobody gets paged. If a server dies at 3 a.m. we find out when the next pull runs or a person notices, whichever is first. For our estate that is an acceptable trade. For a product whose customers pay for uptime it is not, and the right move is to keep this for the daily read and buy a paging service for the one alert that must wake someone.
It is also only as good as the schedule. A pull that runs when someone remembers is a pull that runs after the incident. The run belongs in cron or a scheduled agent session, and the dated notes belong somewhere the next session reads first.
What to do on Monday
If your services sit behind kamal-proxy, Caddy, Traefik or nginx with JSON logging, you already collect what an APM’s transaction page shows. Check that the log carries a duration and a service name. Set Docker’s log rotation so the files cover at least two days. Then run shoestring’s boxwatch once against your hosts and read the summary. It reads kamal-proxy’s format as shipped; another proxy needs a few lines of field mapping in one function. We expect the first run to find something on most small estates, because the first run is usually the first time anyone looked.
The expensive part of monitoring was never the graphs. It was making sure somebody reads them.
- shoestring (GitHub, MIT): boxwatch, the collector and the agent playbook all code referenced in this piece; credentials and hostnames removed
- kamal-proxy request logging one JSON line per request including status, service, path, user agent and duration
- Apdex specification overview satisfied at or under T, tolerating up to 4T, the score we compute per service